
Rob Welke, from Adelaide, South Australia, took an unusual phone from an irrigator in the late 1990’s. “Rob”, he said, “I think there’s a wheel barrow in my pipeline. Can you locate it?”

Wheel barrows were used to carry kit for reinstating cement lining during mild steel cement lined (MSCL) pipeline construction in the old days. It’s not the first time Rob had heard of a wheel barrow being left in a large pipeline. Legend has it that it happened during the rehabilitation of the Cobdogla Irrigation Area, near Barmera, South Australia, in 1980’s. It is also suspected that it may just have been a believable excuse for unaccounted friction losses in a brand new 1000mm trunk main!
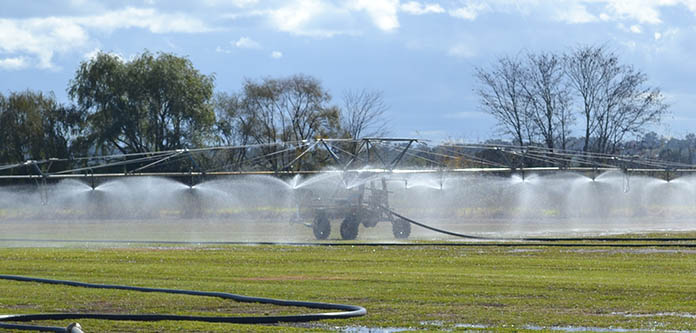
Rob agreed to help his client out. A 500mm dia. PVC rising main delivered recycled water from a pumping station to a reservoir 10km away.
The problem was that, after a year in operation, there was about a 10% reduction in pumping output. The client assured me that he had tested the pumps and they were OK. Therefore, it just had to be a ‘wheel barrow’ in the pipe.
READ: Cheaper irrigation methods for profitable farming
Rob approached this problem much as he had during his time in SA Water, where he had extensive experience locating isolated partial blockages in deteriorated Cast iron Cement Lined (CICL) water supply pipelines during the 1980’s.
Recording hydraulic gradients
He recorded accurate pressure readings along the pipeline at multiple locations (at least 10 locations) which had been surveyed to provide accurate elevation information. The sum of the pressure reading plus the elevation at each point (termed the Peizometric Height) gave the hydraulic head at each point. Plotting the hydraulic heads with chainage gives a multiple point hydraulic gradient (HG), much like in the graph below.

Given that the HG was fairly straight, there was clearly no blockage along the way, which would be evident by a sudden change in slope of the HG at that point.
So, it was figured that the head loss must be due to a general friction build up in the pipeline. To confirm this theory, it was decided to ‘pig’ the pipeline. This involved using the pumps to force two foam cylinders, about 5cm larger than the pipe ID and 70cm long, along the pipe from the pump end, exiting into the reservoir.

The instant improvement in the pipeline friction from pigging was nothing short of amazing. The system head loss had been almost totally restored to original performance, resulting in about a 10% flow improvement from the pump station. So, instead of finding a wheel barrow, a biofilm was found responsible for pipe friction build-up.
Pipeline ENERGY EFFICIENCY
Pipeline performance can be always be viewed from an energy efficiency perspective. Below is a graph showing the biofilm affected (red line) and restored (black line) system curves for the client’s pipeline, before and after pigging.
READ: 5 Factors to consider when choosing irrigation pump
The increase in system head due to biofilm caused the pumps not only to operate at a higher head, but that some of the pumping was forced into peak electricity tariff. The reduced performance pipeline ultimately accounted for about 15% additional pumping energy costs.
Not everyone has a 500NB pipeline!
Well, not everyone has a 500mm pipeline in their irrigation system. So how does that relate to the average irrigator?
A new 500NB

PVC pipe has a Hazen & Williams (H&W) friction value of about C=155. When reduced to C=140 (10%) through biofilm build-up, the pipe will have the equivalent of a wall roughness of 0.13mm. The same roughness in an 80mm pipe represents an H&W C value of 130. That’s a 16% reduction in flow, or a 32% friction loss increase for the same flow! And that’s just in the first year!
Layflat hose can have high energy cost
A case in point was observed in an energy efficiency audit conducted by Tallemenco recently on a turf farm in NSW. A 200m long 3” layflat pipe delivering water to a soft hose boom had a head loss of 26m head compared with the manufacturers rating of 14m for the same flow, and with no kinks in the hose! That’s a whopping 85% increase in head loss. Not surprising considering that this layflat was transporting algae contaminated river water and lay in the hot sun all summer, breeding those little critters on the pipe inside wall.
Calculated in terms of energy consumption, the layflat hose was responsible for 46% of total pumping energy costs through its small diameter with biofilm build-up.
Solution is larger pipe
So, what’s the solution? Move to a larger diameter hose. A 3½” hose has a new pipe head loss of only 6m/200m at the same flow, but when that deteriorates due to biofilm, headloss may rise to only about 10m/200m instead of 26m/200m, kinks and fittings excluded. That’s a potential 28% saving on pumping energy costs*. In terms of absolute energy consumption, if pumping 50ML/yr at 30c/kWh, that’s a saving of $950pa, or $10,700 over 10 years.
Note*: The pump impeller would need to be trimmed or a VFD fitted to potentiate the energy savings. In some cases, the pump may have to be changed out for a lower head pump.
Everyone has a wheel barrow in their pipelines, and it only gets bigger with time. You can’t get rid of it, but you can control its effects, either through energy efficient pipeline design in the first place, or try ‘pigging’ the pipe to get rid of that wheel barrow!!
As for the wheel barrow in Rob’s client’s pipeline, the legend lives on. “He and I still joke about the ‘wheel barrow’ in the pipeline when we can’t explain a pipeline headloss”, said Rob.
Author Rob Welke has been 52 years in pumping & hydraulics, and never sold product in his life! He spent 25 yrs working for SA Water (South Australia) in the late 60’s to 90’s where he conducted extensive pumping and pipeline energy efficiency monitoring on its 132,000 kW of pumping and pipelines infrastructure. Rob established Tallemenco Pty Ltd (2003), an Independent Pumping and Hydraulics’ Consultancy based in Adelaide, South Australia, serving clients Australia wide.
Rob runs regular “Pumping System Master Class” ONLINE training courses Internationally to pass on his wealth of knowledge he learned from his 52 years auditing pumping and pipeline systems throughout Australia.
Rob can be contacted on ph +61 414 492 256, www.talle.biz or email r.welke@talle.biz . LinkedIn – Robert L Welke